
README-en.md 8.4KB
Arrays - Benford’s Law
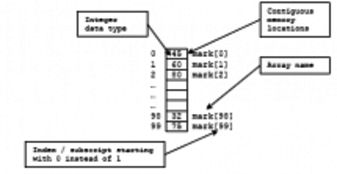


Arrays help us to store and work with groups of data of the same type. The data is stored in consecutive memory spaces which can be accessed by using the name of the array and indexes or subscripts that indicate the position where the data is stored. Repetition structures provide us a simple way of accessing the data within an array. In today’s laboratory experience you will practice the use of counters and one dimensional arrays to implement a program in which you will use Benford’s Law to detect files with bogus data.
Objectives:
Practice using arrays of counters to determine data frequency in a file.
Detect the use of bogus data using Benford’s Law and the leading digit frequency distribution.
Practice reading data from text files.
Pre-Lab
Before coming to the laboratory, you should have:
Learned how to extract the leading digit (first digit from left to right) of an integer read from a file.
Reviewed basic array and counter concepts.
Reviewed text file input in C++.
Studied the concepts and instructions for this laboratory session.
Taken the Pre-Lab quiz found in Moodle.
As part of your new job as IT auditor you suspect that someone in the Chicago Transit Authority (CTA) has been tampering with the information systems and changing the data files that contain the bus route daily totals. You are given five text files that contain daily totals for each of the CTA’s bus routes and must determine if one or more of the files contain bogus data. In this laboratory experience you will implement a program that will help you determine which of the file(s) contain bogus data using Benford’s Law, a property that is observed in many real-life sources of data.
What is Benford’s Law? (copied from the ISACA journal)
Benford’s Law, named for physicist Frank Benford, who worked on the theory in 1938, is the mathematical theory of leading digits. Specifically, in data sets, the leading digit(s) is (are) distributed in a specific, non uniform way. While one might think that the number 1 would appear as the first digit 11 percent of the time (i.e., one of nine possible numbers), it actually appears about 30 percent of the time (see Figure 1). The number 9, on the other hand, is the first digit less than 5 percent of the time. The theory covers the first digit, second digit, first two digits, last digit and other combinations of digits because the theory is based on a logarithm of probability of occurrence of digits.
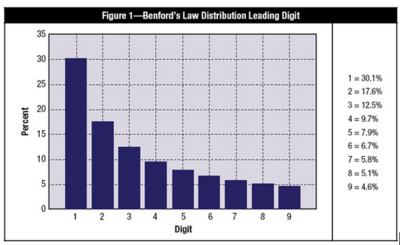
Figure 1. Distribution of the leading digit in a real data set according to Benford’s Law. Taken from [1].
How to use Benford’s Law to spot bogus data
In this laboratory experience you will use Benford’s Law applied only to the leading digit. To do this, you need to determine the frequency of each leading digit in the numbers of the file. Suppose that you are given a file that contains the following integer numbers:
890 3412 234 143 112 178 112 842 5892 19
777 206 156 900 1138 438 158 978 238 192
As you read each number $$n$$, you determine its leading digit (how to extract the leading digit is left as an exercise for you). You must also keep track of how many times the same leading digit appears in the data set. The easiest way to keep track of how many times you find a leading 1, a leading 2, … a leading 9, is to use an array of counters. This array of counters is simply an array of integers where each element is incremented whenever you find a certain leading digit. For instance, for this exercise the array of counters can be an array of 10 integers, initialized to 0.
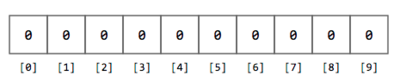
Figure 2. Array of 10 integers initialized to 0.
Every time a leading digit d is found, the element with index d is incremented. For example, after reading the numbers 890, 3412, 234, 143, and 112, the array content would be:
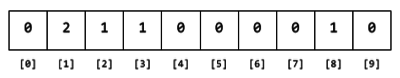
Figure 3. Contents of the array after reading 890, 3412, 234, 143, 112 and counting their leading digits.
After reading through all the data, the content of each array element will be the number of times that leading digit appears in the data.
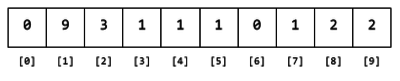
Figure 4. Contents of the array after reading all the data.
The frequency of occurrence is defined as the ratio of times that a digit appears divided by the total number of data. For example, the frequency of leading digit 1 in the example would computed as $$9 / 20 = 0.45$$. Histograms are the preferred visualization of frequency distributions in a data set. In essence, a histogram is a bar chart where the $$y$$-axis is the frequency and a vertical bar is drawn for each of the counted classifications (in our case, for each digit).
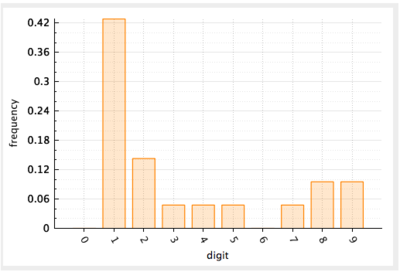
Figure 5. Histogram of the frequency of leading digits in the example data.
!INCLUDE “../../eip-diagnostic/benfords-law/en/diag-benford-law-01.html”
!INCLUDE “../../eip-diagnostic/benfords-law/en/diag-benford-law-02.html”
!INCLUDE “../../eip-diagnostic/benfords-law/en/diag-benford-law-03.html”
!INCLUDE “../../eip-diagnostic/benfords-law/en/diag-benford-law-04.html”
Laboratory session
Exercise 1: Familiarizing yourself with the data files and the provided code
Instructions
Load the project
BenfordsLawonto QtCreator by double clicking the fileBenfordsLaw.proin the folderDocuments/eip/Arrays-BenfordsLawon your computer. You can also go tohttp://bitbucket.org/eip-uprrp/arrays-benfordslawto download theArrays-BenfordsLawfolder to your computer.The text files
cta-a.txt,cta-b.txt,cta-c.txt,cta-d.txt, andcta-e.txtin thedatadirectory contain either real or bogus data. Each line of the file specifies the bus route code and the number of users for that route on a certain day. Open the filecta-a.txtto understand the data format. This will be important when reading the file sequentially using C++. Notice that some of the route codes contain characters.Open the
main.cppfile. Study themainfunction and make sure that you understand all of its parts. In essence, the providedmainfunction creates a window that displays a histogram like the one shown in Figure 6.
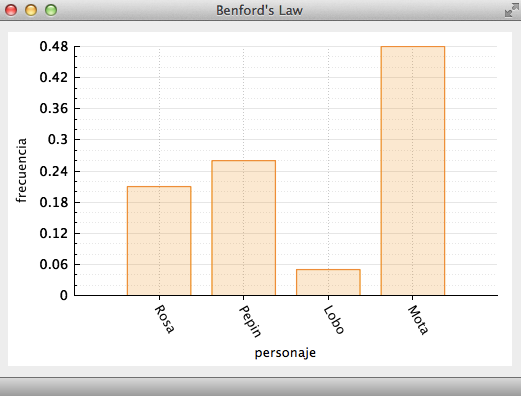
**Figure 6.** Result of running the provided program. A histogram is displayed using the data in the arguments `histoNames` and `histoValues`.

---
In the provided code, notice that the data in the arrays histoNames and histoValues were assigned directly in their declarations. For the provided files, your program should compute the frequency of occurrence of the leading digits and then display their histogram by using the histo method.
Exercise 2: Implement a program to detect bogus data in the data files
Instructions
Using the provided
mainfunction as inspiration, add the necessary code to implement a program that reads a text data file like the ones in thedatafolder and determines the frequency of occurrence of the leading digits of the second column of the files. Compute the frequency of occurrence as it was explained before Figure 5.Once your program has the frequency of occurrence of the leading digits, use the method
histoto display the histogram. Run the program for each of the text files. Based on the leading digit frequency distribution for each file, decide if (according to Benford’s Law) the file contains real or bogus data.
Deliverables
Use “Deliverables 1” in Moodle to upload the
main.cppfile with the modifications you made in Exercise 2. Remember to use good programming techniques, include the names of the programmers involved, and to document your program.Use “Deliverables 2” in Moodle to upload a pdf file that contains screen shots of the histograms produced after analyzing each text file. Please caption each figure with the name of the text file and provide your decision as to whether the file contained real or bogus data.