
README-en.md 14KB
Recursion - Grid Plotter
[Version Verano 2016- Tatiana]
Recursion is a technique that is commonly used in programming. With this technique, problems are done by solving similar problems but for smaller cases. We can construct sets of objects or tasks using recursive rules and initial values. Recursive functions are functions that are self-invoking, using smaller sets or elements each time, until reaching a point where an initial value is used instead of self-invoking. In this laboratory experience, you will implement some tools to draw and practice the use of recursive functions to fill with color some figures.
Objectives:
- Define and implement recursive functions.
- Practice the use of repetition structures.
This laboratory experience is an adaptation of the homework GridPlotter presented by Alyce Brady and Pamela Cutter in [1]. The implementation of the grid and the ability to paint in it was presented by Sacha Schutz in [2] but it was fixed, modified and adapted for this laboratory experience.
Pre-Lab:
Before arriving at the laboratory you should have:
Reviewed the concepts related to recursive functions.
Studied the concepts and instructions for the laboratory session.
Taken the Pre-Lab quiz, available in Moodle.
Drawing Applications
Probably many Windows OS users (if not all of them) have used the program called Paint, which is a simple drawing application. In that program, like many other drawing programs, there are several tools (for example: the pencil, the paint bucket and the line) that lets the user draw on the area in different ways.
In this laboratory experience, we will make some tools (square, circle, triangle, some special lines) work … don’t worry!, we will do it in a very simple way.
The drawing will be on a grid. The tools will be used by clicking any cell in the grid and, from that point, the necessary cells that make the figure will be painted. For example, if we choose the vertical line tool and we click the cell in position (2,3), a vertical line will be drawn in all of the cells in column 2. That is, all of the cells in position $(2,y)$ will be marked for all of the $y$ in the grid.
Qt Coordinates:
The coordinate system in
Qtworks a bit differently, as it is shown in Figure 1. The entries go from left to right, from 0 to the maximum width, and from top to bottom, from 0 to the maximum height.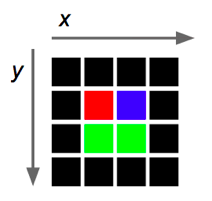
Figure 1. The image shows the direction in which the coordinates are ordered in
Qtimages.When we want to insert two-dimensional data (like the entries of a grid that has coordinates in $x$ y $y$) in an one-dimensional array we use a formula to convert every coordinate $(x,y)$ to an index $i$ of the array. For every point with coordinates $(x,y)$ in the grid, we evaluate $i=(number-of-columns)*y+x$, where
number-of-columnsrepresents the width of the two-dimensional array, and the result $i$ will be the index of the one-dimensional array that corresponds to the point with coordinates $(x,y)$ in the grid. For example, the index $i$ that corresponds to the point $(1,2)$ in the grid of width $5$ is $i=(5)*2+1=11$.
Libraries
In this project, you will need to use the following QtGlobal functions for the implementation of the circle.
int qFloor(qreal v)// Returns the “floor” value $v$.qreal qSqrt(qreal v)// Returns the square root of the value $v$.qreal qPow(qreal x, qreal y)// Returns the value of $x$ to the power $y$.
In addition, you will need to use the function that paints the grid:
void switchOn(int x, int y, const QColor& color);// Paints the cell $(x,y)$ with the given color. (You don’t have to worry aboutQColorbecause it is passed by the function’s parameter)
Although the archive tools.cpp is not visible, there is an array called mColorsthat contains the color of all the cells in the grid. This will help you know which color is in the cell: mColors[columns * y + x]. Note that the index of the array is calculated using the conversion explained above that changes the coordinates $(x,y)$ to an index.
!INCLUDE “../../eip-diagnostic/gridplot/es/diag-gridplot-01.html”
!INCLUDE “../../eip-diagnostic/gridplot/es/diag-gridplot-02.html”
Laboratory Session:
Exercise 1: Implement the functions that operate the buttons for drawing lines
Instructions
Load the project
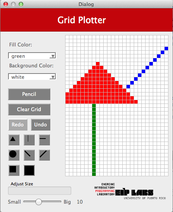
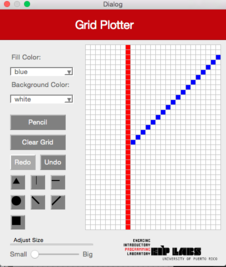
GridPlotterintoQtCreator. There are two ways to do this:* Using the virtual machine: Double click the file `GridPlotter.pro` located in the folder `home/eip/labs/recursion-gridplotter` of your virtual machine. * Downloading the project's folder from `Bitbucket`: Use a terminal and write the command `git clone http://bitbucket.org/eip-uprrp/recursion-gridplotter' to download the folder `recursion-gridplotter` from `Bitbucket`. Double click the file `nombre.pro` located in the folder that you downloaded to your computer.The project contains the skeleton for the application that draws lines and figures in a grid. The application has an interface that allows the user to select the color we want to draw with, the color of the background of the grid, the figure you want to draw (for example, the circle or the square) and the size of the figure. The selected figure is drawn when the user clicks a cell in the grid.
You will be working with the archive called tools.cpp. Your first task is to implement the functions RowMajorFill, ColMajorFill, DiagonalLeft and DiagonalRight that make the buttons that draw lines work. The function RowMajorFill is already implemented for you to use as an example. The functions should work as indicated below.
RowMajorFill
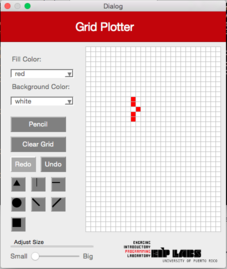
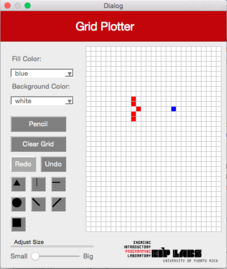
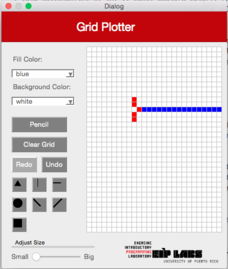
When you select the horizontal line figure in the interface, a horizontal line will be drawn on the grid on the row the user clicked. The line will expand to the right and left of the clicked cell until if finds a cell (pixel) with a different color as the background color, or until the grid ends. Figure 2 illustrates this behavior.
| (a) | (b) | © |
|---|----|----|
|  |
|  |
|  |
|
Figure 2 - (a) A drawing with a white background with red dots. (b) When the user clicks on the horizontal line button (RowMajorFill) and clicks the cell shown, © a horizontal line that expands to the left and to the right of the cell clicked is drawn, until it finds a cell with a different color from the color of the background.
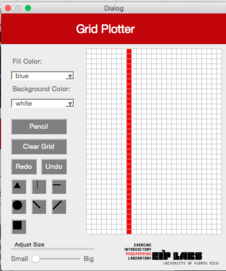
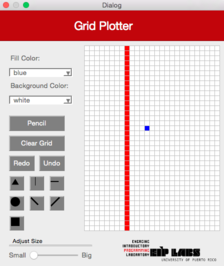
ColMajorFill
This function should work similarly as the function RowMajorFill but for columns. Figure 3 illustrates its behavior.
| (a) | (b) | © |
|---|----|----|
|  |
|  |
|  |
|
Figure 3 - (a) A drawing with a white background and red dots (b) When the user clicks on the vertical line button (ColMajorFill) and clicks the cell shown, © a vertical line that expands to the left and to the right of the cell clicked is drawn, until it finds a cell with a different color from the color of the background.
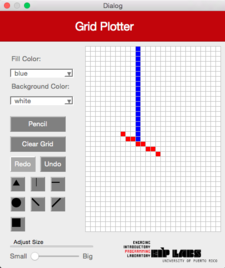
DiagonalLeft
This function should work similarly as the RowMajorFill function but produces a diagonal line from the left superior corner to the right inferior corner. Figure 4 illustrates its behavior.
| (a) | (b) | © |
|---|----|----|
|  |
|  |
|  |
|
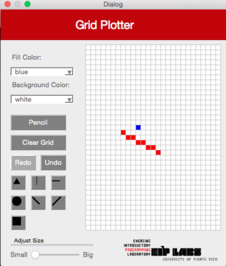
Figure 4 - (a) A drawing with a white background and red dots. (b) When the user clicks on the left diagonal line button (DiagonalLeft) and clicks the cell shown, © a left diagonal line that expands towards the top to the left and towards the bottom to the right of the cell clicked is drawn, until it finds a cell with a different color from the color of the background.
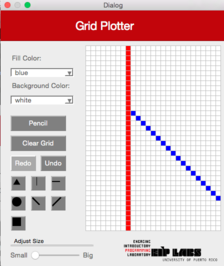
DiagonalRight
This function should work similarly as the DiagonalLeft function but produce a diagonal line from the superior right corner to the inferior left corner. Figure 5 ilustrates its behavior.
| (a) | (b) | © |
|---|----|----|
| | |  |
|
Figure 5 - (a) A drawing with a white background and red dots. (b) When the user clicks on the right diagonal line button (DiagonalRight) and clicks the cell shown, © a right diagonal line that expands towards the top to the right and towards the bottom to the left of the cell clicked is drawn, until it finds a cell with a different color from the color of the background.
Exercise 2: Implement the functions that operate the buttons for drawing square, triangles and circles.
Now, you will implement the functionality so that you can draw squares, circles and triangles. The size of the figure drawn will depend on the size select with sliding bar in the interface.
2a: Squares
For the squares, the easiest way to think of it is as if they were onions! A square of size 1 is simply the cell clicked by the user. A square of size 2 is the cell clicked by the user, covered by a layer of cells of size 1, and so on. In other words, a square of size $n$ will have height = width = $2n-1$.
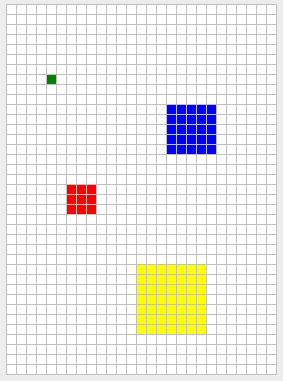
Figure 6 - Squares of size 1 (green), 2 (red), 3 (blue), and 4 (yellow). In each case, the user clicked the center of the square.
2b: Triangles
El botón de triángulo produce un triángulo isóceles como se muestra en la Figura 7. Para un tamaño $n$ seleccionado, el tamaño de la base será $2n + 1$. La altura debe ser $n+1$.
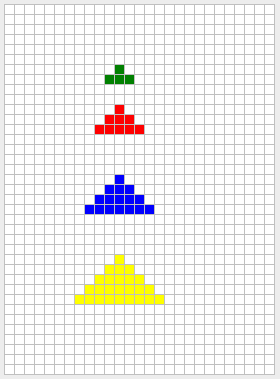
Figura 7 - Triángulos de tamaño 1 (verde), 2 (rojo), 3 (azul), y 4 (amarillo). En cada caso, el usuario marcó la celda del centro de la base del triángulo.
2c: Círculos
¡Felicitaciones! ¡Llegaste hasta la parte más difícil: círculos! Aquí tendrás que utilizar tus destrezas matemáticas … esperamos que te haya ido bien en tu clase de pre-cálculo …
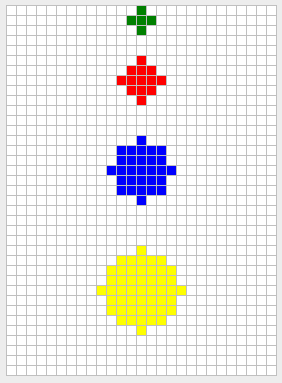
Figura 8 - Círculos de tamaño 1 (verde), 2 (rojo), 3 (azul), y 4 (amarillo). En cada caso, el usuario marcó la celda del centro del círculo.
Ayuda para producir los círculos:
Primero necesitas entender las expresiones asociadas a un círculo con ecuación: $x^2+y^2=r^2$. Por ejemplo, consideremos un círculo con radio $r=1$. La ecuación $x^2+y^2=1$ nos dice que todo punto $(x,y)$ que satisfaga la ecuación es un punto en la circunferencia del círculo. La expresión para un círculo relleno es: $x^2 + y^2 <=r^2$. Un círculo relleno, de radio $r=1$ tiene expresión $x^2 + y^2 <= 1$, lo que dice que cualquier punto $(x,y)$ que satisfaga $x^2 + y^2 <= 1$ es un punto en el círculo relleno.
¿Cómo producimos el círculo? Una manera sería generar todos los puntos cercanos al centro del círculo y determinar si éstos satisfacen la expresión $x^2 + y^2 <= r^2$. Por ejemplo, podemos tratar todos los puntos que están en el cuadrado de tamaño $2r+1$. Para un círculo de radio $r=2$ tendríamos que generar los siguientes puntos y probarlos en la expresión $x^2 + y^2 <=4$:
(-2, 2) (-1, 2) ( 0, 2) ( 1, 2) ( 2, 2)
(-2, 1) (-1, 1) ( 0, 1) ( 1, 1) ( 2, 1)
(-2, 0) (-1, 0) ( 0, 0) ( 1, 0) ( 2, 0)
(-2,-1) (-1,-1) ( 0,-1) ( 1,-1) ( 2,-1)
(-2,-2) (-1,-2) ( 0,-2) ( 1,-2) ( 2,-2)
En este caso, solo los puntos que se muestran abajo satisfacen la expresión $x^2 + y^2 <=4$.
                ( 0, 2)
        (-1, 1) ( 0, 1) ( 1, 1)
(-2, 0) (-1, 0) ( 0, 0) ( 1, 0) ( 2, 0)
        (-1,-1) ( 0,-1) ( 1,-1)
                ( 0,-2)
Ejercicio 3: Implementar la función para rellenar figuras utilizando recursión.
En este ejercicio implementarás la funcionalidad para rellenar de color las figuras. Una de las maneras más convenientes para expresar el algoritmo para rellenar es utilizando recursión. Un algoritmo recursivo básico (pero bastante flojo) se encuentra en Wikipedia:
Relleno (celda, color-buscado, color-reemplazo):
 1. Si color-buscado es igual al color-reemplazo, return.
 2. Si el color de celda no es igual al  color-buscado, return.
 3. Ajusta el color de celda al color-reemplazo.
 4. Ejecuta Relleno (un lugar a la izquerda de celda, color-buscado, color-reemplazo).
    Ejecuta Relleno (un lugar a la derecha de celda, color-buscado, color-reemplazo).
    Ejecuta Relleno (un lugar arriba de celda, color-buscado, color-reemplazo).
    Ejecuta Relleno (un lugar abajo de celda, color-buscado, color-reemplazo).
 5. Return.
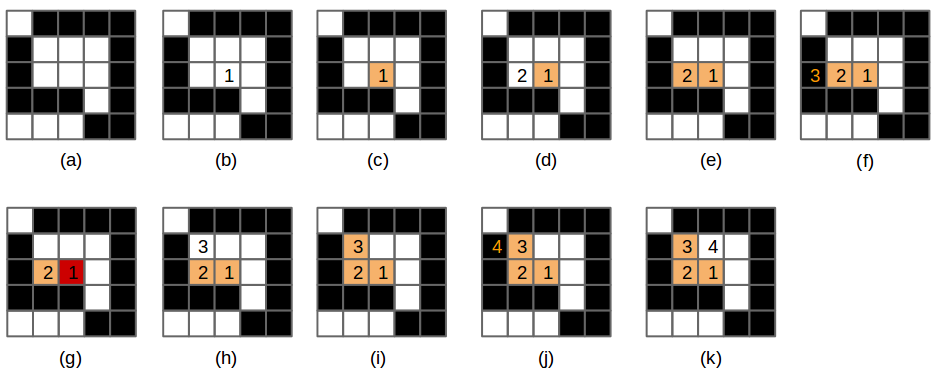
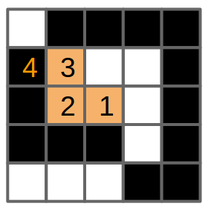
Figura 9 - (a) El dibujo original con trasfondo blanco y celdas negras. (b) Se selecciona una celda y se ejecuta el algoritmo de rellenar en esa celda (1), © La celda se pinta anaranjada, entonces (d) invoca relleno en la celda de la izquierda (2). (e) La celda 2 se pinta anaranjada, entonces (f) invoca relleno en la celda de la izquierda (3). Esta celda no es de color-buscado (es negra), la función regresa (returns).
(g) relleno se invoca en la celda de la derecha de la celda 2, pero esa celda ya está pintada del color-reemplazo. (h) relleno se invoca en la celda de arriba de la celda 2. (i) Esta celda se pinta anaranjada e (j) invoca relleno en la celda de la izquierda (4). Esta celda no es de color-buscado, por lo tanto la función regresa (k), celda (3) invoca relleno en su celda derecha.
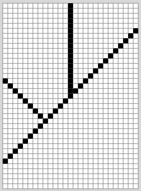
Invoca la función relleno (flood-fill) y prueba su funcionamiento utilizando varias figuras. Asegúrate de probar figuras abiertas, como, por ejemplo, la siguiente:
Entregas
Utiliza “Entrega” en Moodle para entregar el archivo tools.cpp con las funciones que implementaste en esta experiencia de laboratorio. Recuerda utilizar buenas prácticas de programación, incluir el nombre de los programadores y documentar tu programa.
Referencias
[1] Alyce Brady and Pamela Cutter, http://nifty.stanford.edu/2005/GridPlotter/
[2] Sacha Schutz, http://www.labsquare.org
[3] http://en.wikipedia.org/wiki/Flood_fill