
README-en.md 10KB
Repetition Structures - Grid Plotter
Objectives
Throughout this exercise the students will practice:
- For loops
- Nested for loops
Concepts
Possibly many users of Windows OS (if not the most) have used the Paint program, which is a simple graphics painting application. In that software, as in many others graphics painting programs, there are various tools (eg. pencil, paint bucket, line) which allows the user to draw on the graph in different ways.
In this laboratory we will make work some of these tools: square, circle, triangle, and some special lines… but don’t worry, it will be made in a simpler way.
The tools will be used by clicking any cell in the grid and (from that point) the cells required to form that shape will be painted. For example, if we use the vertical-line tool and then click on the cell (2,3) a vertical line should be painted over all the cells on the column 2 [(2, y) for all y into the grid].
Things you should know or recall:
- The coordinates in Qt goes a little bit different. From left to right is from zero to maximum width. From top to bottom is from 0 to maximum height.
- When we want to insert bidimensional data (such as the grid that has x and y) into a simple array we use a formula. For every point (x,y) in the grid, we solve number-of-columns * y + x and the result will be the index of the point in the array. Example: The index of the point (1,2) in a 5 width grid is 5*2+1 = 11
Libraries
For this project you only need to use some of the functions of QtGlobal for the implementation of the circle:
- int qFloor(qreal v) // Returns the floor of the value v.
- qreal qSqrt(qreal v) // Returns the square root of v.
- qreal qPow(qreal x, qreal y) // Returns the value of x raised to the power of y.
And use the funcion that paints on the grid:
- void switchOn(int x, int y, const QColor& color); //It paints the cell (x,y) with the color given. (You don’t have to worry about QColor because is given to you by parameter.)
Though it is not visible in this file (tools.cpp), there exists an array called mColors that contains the colors of all the cells of the grid. This will help you to know what color is in a cell: mColors[columns * y + x]
!INCLUDE “../../eip-diagnostic/gridplot/en/diag-gridplot-01.html”
!INCLUDE “../../eip-diagnostic/gridplot/en/diag-gridplot-02.html”
Laboratory session:
Exercise 1
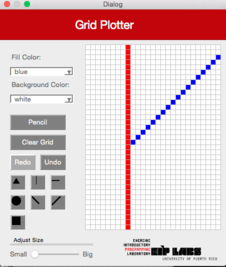
The Qt project at HERE??? contains the skeleton for an application to draw lines or shapes on a grid. The application allows the user to select the color to paint, the color of the grid background, the painting shape (e.g., circle, square) and size of the tool. The selected shape is drawn when the user clicks the grid.
Your first job is to implement the functions to make the row-major-fill, col-major-fill, left-diagonal and right-diagonal buttons work. The function row-major-fill has been implemented for you as an example. The functions should work as follows.
row-major:
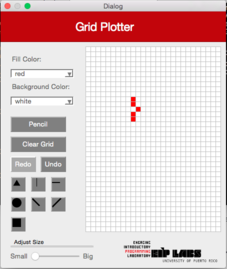
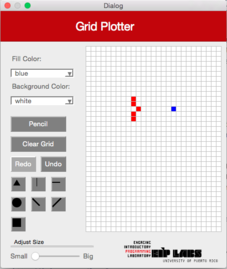
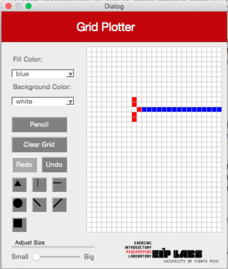
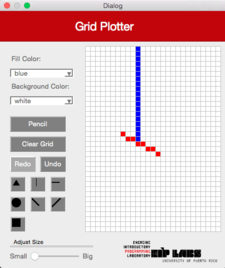
When this shape is chosen, a horizontal line will shall be drawn in the grid in the row where the user clicks. The line should expand to the left and right of the cell clicked by the user until it finds a pixel whose color is not the background color (or the grid ends). Figure 1 illustrates this behavior.
| (a) | (b) | © |
|---|----|----|
|  |
|  |
|  |
|
Figure 1 - (a) A painting with a white background and red dots. (b) When the user clicks the row-major button and clicks the shown cell © a horizontal line is drawn that expands to the left and right of the clicked cell until a cell of non-background color is found.
columns-major
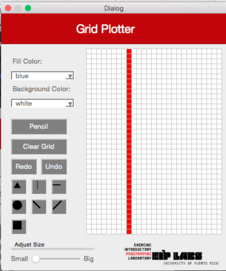
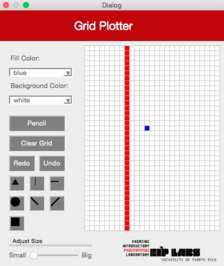
This button should work similar to the row-major but for columns. Figure 2 illustrates this behavior.
| (a) | (b) | © |
|---|----|----|
|  |
|  |
|  |
|
Figure 2 - (a) A painting with a white background and red dots. (b) When the user clicks the columns-major button and clicks the shown cell, © a vertical line is drawn that expands to the top and botton of the clicked cell until a cell of non-background color is found.
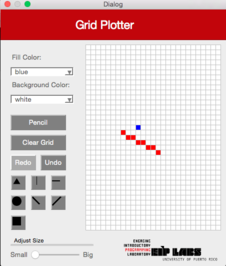
left-diagonal
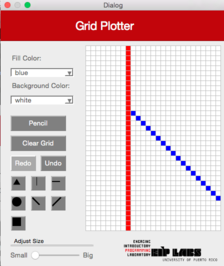
This button should work similar to the row-major but produces a diagonal from upper left to lower right. Figure 3 illustrates this behavior.
| (a) | (b) | © |
|---|----|----|
|  |
|  |
|  |
|
Figure 3 - (a) A painting with a white background and red dots. (b) When the user clicks the left-diagonal button and clicks the shown cell © a left-diagonal line is drawn that expands from the top left to the bottom right of the clicked cell until a cell of non-background color is found.
right-diagonal
This button should work similar to the left-diagonal but produces a diagonal from bottom left to top right. Figure 4 illustrates this behavior.
| (a) | (b) | © |
|---|----|----|
| | |  |
|
Figure 4 - (a) A painting with a white background and red dots. (b) When the user clicks the right-diagonal button and clicks the shown cell © a right-diagonal line is drawn that expands from the bottom left to the top right of the clicked cell until a cell of non-background color is found.
Exercise 2 a
Let’s implement the functionality to draw the square, triangle and circle. The size of the drawn shape will depend in the size chosen using the slide bar.
For the squares (the easiest) you may think of them as if they were onions! A square of size 1 is just the cell clicked by the user. A square of size 2 is the clicked cell with a layer of 1 cell, and so forth. In other words, a square of size $n$ will have height = width = $2n-1$
Figure 5 - Squares of size 1 (green), 2 (red), 3 (blue), and 4 (yellow). In each case, the user clicked on the cell at the center of the square.
Exercise 2 b
The triangle button should produce an isosceles triangles as shown in Figure 6. For a chosen size n the base will be $2n + 1$. The height should be $n + 1$.
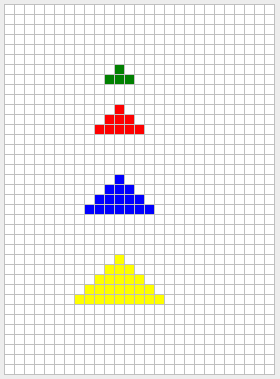
Figure 5 - Triangles of size 1 (green), 2 (red), 3 (blue), and 4 (yellow). In each case, the user clicked on the cell at the center of the base of the triangle.
Exercise 2 c
Congrats, you made it to the hardest part: circles! Here you need to use your math skills… hope you did well in that class.
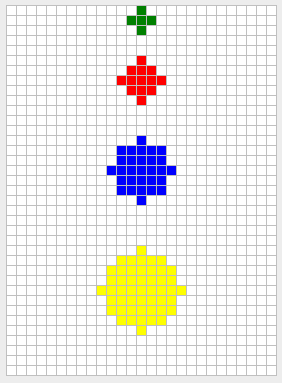
Figure 5 - Circles of size 1 (green), 2 (red), 3 (blue), and 4 (yellow). In each case, the user clicked on the cell at the center the circle.
Here is a hint on how to produce the circles. You need to start by understanding what their equation ($r^2 = y^2 + x^2$) means. As an example, lets consider $r=1$. The equation for a circle with $r = 1$ means that any point $(x,y)$ such that $x^2 + y^2 = 1$ is a point in the circumference of the circle. The equation for a filled circle is $x^2 + y^2 <=r^2$. A filled circle of radius 1 has an equation $x^2 + y^2 <= 1$, which means that any point $(x,y)$ such that $x^2 + y^2 <= 1$ is a point in filled circle.
How to produce a circle? One way would be to generate all points in the proximity of the center of the circle and determine if they comply with $x^2 + y^2 <= r^2$. For example, we could try every point that is in the square of size $2r+1$. For a circle of $r=2$ we would need to generate all the following points and test them against the $x^2 + y^2 <=4$ equation:
(-2, 2) (-1, 2) ( 0, 2) ( 1, 2) ( 2, 2)
(-2, 1) (-1, 1) ( 0, 1) ( 1, 1) ( 2, 1)
(-2, 0) (-1, 0) ( 0, 0) ( 1, 0) ( 2, 0)
(-2,-1) (-1,-1) ( 0,-1) ( 1,-1) ( 2,-1)
(-2,-2) (-1,-2) ( 0,-2) ( 1,-2) ( 2,-2)
In this case, only the shown points would comply to the equation.
                ( 0, 2)
        (-1, 1) ( 0, 1) ( 1, 1)
(-2, 0) (-1, 0) ( 0, 0) ( 1, 0) ( 2, 0)
        (-1,-1) ( 0,-1) ( 1,-1)
                ( 0,-2)
Exercise 3
You will now implement the flood fill functionality. One of the most convenient ways to express the algorithm for flood fill is using recursion. A basic (but rather wastefull) recursive algorithm is given in Wikipedia:
Flood-fill (node, target-color, replacement-color):
 1. If target-color is equal to replacement-color, return.
 2. If the color of node is not equal to target-color, return.
 3. Set the color of node to replacement-color.
 4. Perform Flood-fill (one step to the west of node, target-color, replacement-color).
    Perform Flood-fill (one step to the east of node, target-color, replacement-color).
    Perform Flood-fill (one step to the north of node, target-color, replacement-color).
    Perform Flood-fill (one step to the south of node, target-color, replacement-color).
 5. Return.
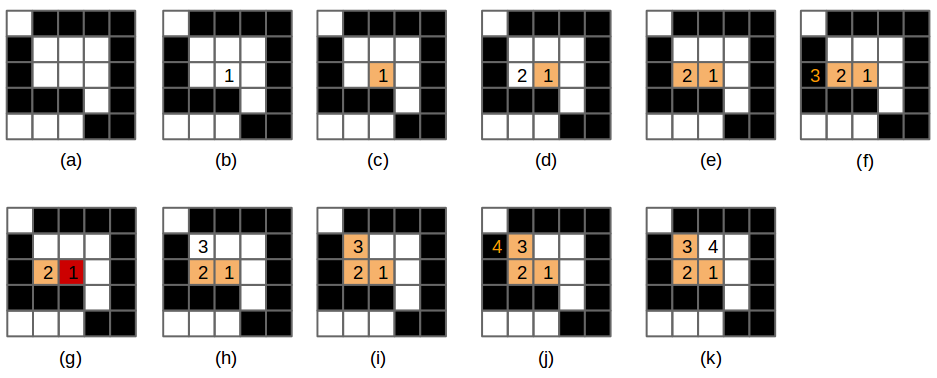
Figure 6 - (a) The original drawing with white background and black pixels. (b) A pixel is chosen and the flood fill algorithm is run on that cell (1), © the cell is painted orange, then (d) invokes flood-fill on its west cell (2). (e) cell 2 is painted orange, then (f) invokes flood-fill on its west cell (3). This cell is not of the target color (it is black), the function returns. (g) flood fill is invoked on the cell to the east of cell 2, however that cell is already changed to the target color. (h) flood fill is invoked on the cell to the north of cell 2. (i) This cell is painted orange and (j) invokes flood cell on its west cell (4). This cell is not of target color, thus the function returns (k) cell (3) invokes flood fill on its east cell.
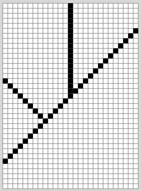
Implement the flood fill function and test filling out various shapes. Be sure to test open shapes, such as the following:
Deliverables
In the following textboxes, copy the functions that you developed for the program. Remember to properly comment all functions and use good indentation and variable naming practices.
References
[1] Alyce Brady and Pamela Cutter, http://nifty.stanford.edu/2005/GridPlotter/
[2] Sacha Schutz, http://www.labsquare.org