|
My Project
|
A plottable representing a parametric curve in a plot. Más...
Tipos públicos | |
| enum | LineStyle { lsNone, lsLine } |
Métodos públicos | |
| QCPCurve (QCPAxis *keyAxis, QCPAxis *valueAxis) | |
| QCPCurveDataMap * | data () const |
| QCPScatterStyle | scatterStyle () const |
| LineStyle | lineStyle () const |
| void | setData (QCPCurveDataMap *data, bool copy=false) |
| void | setData (const QVector< double > &t, const QVector< double > &key, const QVector< double > &value) |
| void | setData (const QVector< double > &key, const QVector< double > &value) |
| void | setScatterStyle (const QCPScatterStyle &style) |
| void | setLineStyle (LineStyle style) |
| void | addData (const QCPCurveDataMap &dataMap) |
| void | addData (const QCPCurveData &data) |
| void | addData (double t, double key, double value) |
| void | addData (double key, double value) |
| void | addData (const QVector< double > &ts, const QVector< double > &keys, const QVector< double > &values) |
| void | removeDataBefore (double t) |
| void | removeDataAfter (double t) |
| void | removeData (double fromt, double tot) |
| void | removeData (double t) |
| virtual void | clearData () |
| virtual double | selectTest (const QPointF &pos, bool onlySelectable, QVariant *details=0) const |
 Métodos públicos heredados desde QCPAbstractPlottable Métodos públicos heredados desde QCPAbstractPlottable | |
| QCPAbstractPlottable (QCPAxis *keyAxis, QCPAxis *valueAxis) | |
| QString | name () const |
| bool | antialiasedFill () const |
| bool | antialiasedScatters () const |
| bool | antialiasedErrorBars () const |
| QPen | pen () const |
| QPen | selectedPen () const |
| QBrush | brush () const |
| QBrush | selectedBrush () const |
| QCPAxis * | keyAxis () const |
| QCPAxis * | valueAxis () const |
| bool | selectable () const |
| bool | selected () const |
| void | setName (const QString &name) |
| void | setAntialiasedFill (bool enabled) |
| void | setAntialiasedScatters (bool enabled) |
| void | setAntialiasedErrorBars (bool enabled) |
| void | setPen (const QPen &pen) |
| void | setSelectedPen (const QPen &pen) |
| void | setBrush (const QBrush &brush) |
| void | setSelectedBrush (const QBrush &brush) |
| void | setKeyAxis (QCPAxis *axis) |
| void | setValueAxis (QCPAxis *axis) |
| Q_SLOT void | setSelectable (bool selectable) |
| Q_SLOT void | setSelected (bool selected) |
| virtual bool | addToLegend () |
| virtual bool | removeFromLegend () const |
| void | rescaleAxes (bool onlyEnlarge=false) const |
| void | rescaleKeyAxis (bool onlyEnlarge=false) const |
| void | rescaleValueAxis (bool onlyEnlarge=false) const |
| Métodos públicos heredados desde QCPLayerable | |
| QCPLayerable (QCustomPlot *plot, QString targetLayer="", QCPLayerable *parentLayerable=0) | |
| bool | visible () const |
| QCustomPlot * | parentPlot () const |
| QCPLayerable * | parentLayerable () const |
| QCPLayer * | layer () const |
| bool | antialiased () const |
| void | setVisible (bool on) |
| bool | setLayer (QCPLayer *layer) |
| bool | setLayer (const QString &layerName) |
| void | setAntialiased (bool enabled) |
| bool | realVisibility () const |
Métodos protegidos | |
| virtual void | draw (QCPPainter *painter) |
| virtual void | drawLegendIcon (QCPPainter *painter, const QRectF &rect) const |
| virtual QCPRange | getKeyRange (bool &validRange, SignDomain inSignDomain=sdBoth) const |
| virtual QCPRange | getValueRange (bool &validRange, SignDomain inSignDomain=sdBoth) const |
| virtual void | drawScatterPlot (QCPPainter *painter, const QVector< QPointF > *pointData) const |
| void | getCurveData (QVector< QPointF > *lineData) const |
| double | pointDistance (const QPointF &pixelPoint) const |
| QPointF | outsideCoordsToPixels (double key, double value, int region, QRect axisRect) const |
| Métodos protegidos heredados desde QCPAbstractPlottable | |
| virtual QRect | clipRect () const |
| virtual QCP::Interaction | selectionCategory () const |
| void | applyDefaultAntialiasingHint (QCPPainter *painter) const |
| virtual void | selectEvent (QMouseEvent *event, bool additive, const QVariant &details, bool *selectionStateChanged) |
| virtual void | deselectEvent (bool *selectionStateChanged) |
| void | coordsToPixels (double key, double value, double &x, double &y) const |
| const QPointF | coordsToPixels (double key, double value) const |
| void | pixelsToCoords (double x, double y, double &key, double &value) const |
| void | pixelsToCoords (const QPointF &pixelPos, double &key, double &value) const |
| QPen | mainPen () const |
| QBrush | mainBrush () const |
| void | applyFillAntialiasingHint (QCPPainter *painter) const |
| void | applyScattersAntialiasingHint (QCPPainter *painter) const |
| void | applyErrorBarsAntialiasingHint (QCPPainter *painter) const |
| double | distSqrToLine (const QPointF &start, const QPointF &end, const QPointF &point) const |
| Métodos protegidos heredados desde QCPLayerable | |
| virtual void | parentPlotInitialized (QCustomPlot *parentPlot) |
| void | initializeParentPlot (QCustomPlot *parentPlot) |
| void | setParentLayerable (QCPLayerable *parentLayerable) |
| bool | moveToLayer (QCPLayer *layer, bool prepend) |
| void | applyAntialiasingHint (QCPPainter *painter, bool localAntialiased, QCP::AntialiasedElement overrideElement) const |
Atributos protegidos | |
| QCPCurveDataMap * | mData |
| QCPScatterStyle | mScatterStyle |
| LineStyle | mLineStyle |
| Atributos protegidos heredados desde QCPAbstractPlottable | |
| QString | mName |
| bool | mAntialiasedFill |
| bool | mAntialiasedScatters |
| bool | mAntialiasedErrorBars |
| QPen | mPen |
| QPen | mSelectedPen |
| QBrush | mBrush |
| QBrush | mSelectedBrush |
| QPointer< QCPAxis > | mKeyAxis |
| QPointer< QCPAxis > | mValueAxis |
| bool | mSelectable |
| bool | mSelected |
| Atributos protegidos heredados desde QCPLayerable | |
| bool | mVisible |
| QCustomPlot * | mParentPlot |
| QPointer< QCPLayerable > | mParentLayerable |
| QCPLayer * | mLayer |
| bool | mAntialiased |
Amigas | |
| class | QCustomPlot |
| class | QCPLegend |
Otros miembros heredados | |
| Señales heredados desde QCPAbstractPlottable | |
| void | selectionChanged (bool selected) |
| Tipos protegidos heredados desde QCPAbstractPlottable | |
| enum | SignDomain { sdNegative, sdBoth, sdPositive } |
A plottable representing a parametric curve in a plot.

Unlike QCPGraph, plottables of this type may have multiple points with the same key coordinate, so their visual representation can have loops. This is realized by introducing a third coordinate t, which defines the order of the points described by the other two coordinates x and y.
To plot data, assign it with the setData or addData functions.
The appearance of the curve is determined by the pen and the brush (setPen, setBrush).
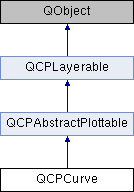
Like all data representing objects in QCustomPlot, the QCPCurve is a plottable (QCPAbstractPlottable). So the plottable-interface of QCustomPlot applies (QCustomPlot::plottable, QCustomPlot::addPlottable, QCustomPlot::removePlottable, etc.)
Usually, you first create an instance:
add it to the customPlot with QCustomPlot::addPlottable:
and then modify the properties of the newly created plottable, e.g.:
| enum QCPCurve::LineStyle |
Defines how the curve's line is represented visually in the plot. The line is drawn with the current pen of the curve (setPen).
| Valores de enumeraciones | |
|---|---|
| lsNone |
No line is drawn between data points (e.g. only scatters) |
| lsLine |
Data points are connected with a straight line. |
Constructs a curve which uses keyAxis as its key axis ("x") and valueAxis as its value axis ("y"). keyAxis and valueAxis must reside in the same QCustomPlot instance and not have the same orientation. If either of these restrictions is violated, a corresponding message is printed to the debug output (qDebug), the construction is not aborted, though.
The constructed QCPCurve can be added to the plot with QCustomPlot::addPlottable, QCustomPlot then takes ownership of the graph.
| void QCPCurve::addData | ( | const QCPCurveDataMap & | dataMap | ) |
Adds the provided data points in dataMap to the current data.
| void QCPCurve::addData | ( | const QCPCurveData & | data | ) |
Esta es una función miembro sobrecargada que se suministra por conveniencia. Difiere de la anterior función solamente en los argumentos que acepta. Adds the provided single data point in data to the current data.
| void QCPCurve::addData | ( | double | t, |
| double | key, | ||
| double | value | ||
| ) |
Esta es una función miembro sobrecargada que se suministra por conveniencia. Difiere de la anterior función solamente en los argumentos que acepta. Adds the provided single data point as t, key and value tuple to the current data
| void QCPCurve::addData | ( | double | key, |
| double | value | ||
| ) |
Esta es una función miembro sobrecargada que se suministra por conveniencia. Difiere de la anterior función solamente en los argumentos que acepta.
Adds the provided single data point as key and value pair to the current data The t parameter of the data point is set to the t of the last data point plus 1. If there is no last data point, t will be set to 0.
| void QCPCurve::addData | ( | const QVector< double > & | ts, |
| const QVector< double > & | keys, | ||
| const QVector< double > & | values | ||
| ) |
Esta es una función miembro sobrecargada que se suministra por conveniencia. Difiere de la anterior función solamente en los argumentos que acepta. Adds the provided data points as t, key and value tuples to the current data.
|
virtual |
Removes all data points.
Implementa QCPAbstractPlottable.
| void QCPCurve::removeData | ( | double | fromt, |
| double | tot | ||
| ) |
Removes all data points with curve parameter t between fromt and tot. if fromt is greater or equal to tot, the function does nothing. To remove a single data point with known t, use removeData(double t).
| void QCPCurve::removeData | ( | double | t | ) |
Esta es una función miembro sobrecargada que se suministra por conveniencia. Difiere de la anterior función solamente en los argumentos que acepta.
Removes a single data point at curve parameter t. If the position is not known with absolute precision, consider using removeData(double fromt, double tot) with a small fuzziness interval around the suspected position, depeding on the precision with which the curve parameter is known.
| void QCPCurve::removeDataAfter | ( | double | t | ) |
| void QCPCurve::removeDataBefore | ( | double | t | ) |
|
virtual |
This function is used to decide whether a click hits a layerable object or not.
pos is a point in pixel coordinates on the QCustomPlot surface. This function returns the shortest pixel distance of this point to the object. If the object is either invisible or the distance couldn't be determined, -1.0 is returned. Further, if onlySelectable is true and the object is not selectable, -1.0 is returned, too.
If the item is represented not by single lines but by an area like QCPItemRect or QCPItemText, a click inside the area returns a constant value greater zero (typically the selectionTolerance of the parent QCustomPlot multiplied by 0.99). If the click lies outside the area, this function returns -1.0.
Providing a constant value for area objects allows selecting line objects even when they are obscured by such area objects, by clicking close to the lines (i.e. closer than 0.99*selectionTolerance).
The actual setting of the selection state is not done by this function. This is handled by the parent QCustomPlot when the mouseReleaseEvent occurs, and the finally selected object is notified via the selectEvent/deselectEvent methods.
details is an optional output parameter. Every layerable subclass may place any information in details. This information will be passed to selectEvent when the parent QCustomPlot decides on the basis of this selectTest call, that the object was successfully selected. The subsequent call to selectEvent will carry the details. This is useful for multi-part objects (like QCPAxis). This way, a possibly complex calculation to decide which part was clicked is only done once in selectTest. The result (i.e. the actually clicked part) can then be placed in details. So in the subsequent selectEvent, the decision which part was selected doesn't have to be done a second time for a single selection operation.
You may pass 0 as details to indicate that you are not interested in those selection details.
Implementa QCPAbstractPlottable.
| void QCPCurve::setData | ( | QCPCurveDataMap * | data, |
| bool | copy = false |
||
| ) |
Replaces the current data with the provided data.
If copy is set to true, data points in data will only be copied. if false, the plottable takes ownership of the passed data and replaces the internal data pointer with it. This is significantly faster than copying for large datasets.
| void QCPCurve::setData | ( | const QVector< double > & | t, |
| const QVector< double > & | key, | ||
| const QVector< double > & | value | ||
| ) |
Esta es una función miembro sobrecargada que se suministra por conveniencia. Difiere de la anterior función solamente en los argumentos que acepta.
Replaces the current data with the provided points in t, key and value tuples. The provided vectors should have equal length. Else, the number of added points will be the size of the smallest vector.
| void QCPCurve::setData | ( | const QVector< double > & | key, |
| const QVector< double > & | value | ||
| ) |
Esta es una función miembro sobrecargada que se suministra por conveniencia. Difiere de la anterior función solamente en los argumentos que acepta.
Replaces the current data with the provided key and value pairs. The t parameter of each data point will be set to the integer index of the respective key/value pair.
| void QCPCurve::setLineStyle | ( | QCPCurve::LineStyle | style | ) |
Sets how the single data points are connected in the plot or how they are represented visually apart from the scatter symbol. For scatter-only plots, set style to lsNone and setScatterStyle to the desired scatter style.
| void QCPCurve::setScatterStyle | ( | const QCPScatterStyle & | style | ) |
Sets the visual appearance of single data points in the plot. If set to QCPScatterStyle::ssNone, no scatter points are drawn (e.g. for line-only plots with appropriate line style).
 1.8.9.1

