
 Jose R Ortiz Ubarri
8ab8829054
tools.cpp edited online with Bitbucket
Jose R Ortiz Ubarri
8ab8829054
tools.cpp edited online with Bitbucket
|
пре 9 година | |
|---|---|---|
| doc | пре 9 година | |
| images | пре 9 година | |
| media | пре 9 година | |
| style | пре 9 година | |
| GridPlotter.pro | пре 9 година | |
| README.md | пре 9 година | |
| dialog.cpp | пре 9 година | |
| dialog.h | пре 9 година | |
| dialog.ui | пре 9 година | |
| grid.cpp | пре 9 година | |
| grid.h | пре 9 година | |
| images.qrc | пре 9 година | |
| main.cpp | пре 9 година | |
| styles.qrc | пре 9 година | |
| tools.cpp | пре 9 година |
README.md
Estructuras de Repetición - Pintar en Cuadrícula
[Version 2016-05-09]
La recursión es una técnica muy utilizada en programación. Con esta técnica se resuelven problemas resolviendo un problema similar pero para casos más pequeños. Podemos construir conjuntos de objetos o procesos utilizando reglas recursivas y valores iniciales. Las funciones recursivas son funciones que se auto-invocan, utilizando cada vez conjuntos o elementos más pequeños, hasta llegar a un punto en donde se utiliza la condición inicial en lugar de auto-invocarse. En esta experiencia de laboratorio implementarás algunas herramientas para dibujar y practicarás el uso de funciones recursivas para rellenar de color algunas figuras.
Objetivos:
- Definir e implementar funciones recursivas.
- Practicar el uso de estructuras de repetición.
Esta experiencia de laboratorio es una adaptación de la asignación GridPlotter presentada por Alyce Brady y Pamela Cutter en [1]. La implementación de la cuadrícula y la capacidad de pintar en ella fue presentada por Sacha Schutz en [2] pero fue arreglada, modificada y adaptada para esta experiencia de laboratorio.
Pre-Lab:
Antes de llegar al laboratorio debes haber:
Repasado los conceptos relacionados a funciones recursivas.
Estudiado los conceptos e instrucciones para la sesión de laboratorio.
Aplicaciones para dibujar
Probablemente muchos usuarios del sistema operativo Windows (¡quizás todos!) han usado el programa Paint, que es una aplicación simple para dibujar. En ese programado, al igual que en muchos otros programados para dibujar, hay varias herramientas (por ejemplo el lápiz, el cubo de pintura, la línea) que le permiten al usuario dibujar en el área de distintas maneras.
En esta experiencia de laboratorio haremos funcionar algunas de esas herramientas: cuadrado, círculo, triángulo, y algunas líneas especiales … ¡no te asustes!, lo haremos de una manera simple.
El dibujo se hará sobre una cuadrilla. Las herramientas se utilizarán marcando cualquier celda en la cuadrilla y, desde ese punto, las celdas necesarias para hacer la figura se pintarán. Por ejemplo, si seleccionamos la herramienta de línea vertical y marcamos la celda en posición (2,3), una línea vertical se dibujará en todas las celdas de la columna 2. Esto es, se marcarán todas las celdas en posición $(2,y)$ para todas las $y$ de la cuadrilla.
Coordenadas en Qt:
El sistema de coordenadas en
Qtfunciona un poco diferente, como muestra la Figura 1. Las entradas van de izquierda a derecha, desde 0 hasta un ancho máximo, y desde arriba hasta abajo, desde 0 hasta una altura máxima.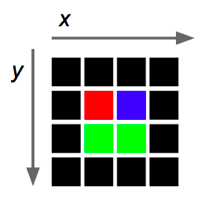
Figura 1. La imagen muestra la dirección en que se ordenan las coordenadas en las imágenes de
Qt.Cuando queremos insertar datos bi-dimensionales (como las entradas de una cuadrilla que tiene coordenadas en $x$ y $y$) en un arreglo de una dimensión usamos una fórmula para convertir cada coordenada $(x,y)$ a un índice $i$ del arreglo. Para cada punto con coordenadas $(x,y)$ en la cuadrilla, evaluamos $i=(número-de-columnas)*y+x$, en donde
número-de-columnasrepresenta el ancho del arreglo bi-dimensional, y el resultado $i$ será el índice del arreglo de una dimensión que corresponde al punto con coordenadas $(x,y)$ en la cuadrilla. Por ejemplo, el índice $i$ correspondiente al punto $(1,2)$ en una cuadrilla de ancho $5$ es $i=(5)*2+1=11$.
Bibliotecas
Para este proyecto necesitarás utilizar las funciones de QtGlobal para la implementación del círculo:
int qFloor(qreal v)// Devuelve el “piso” del valor $v$.qreal qSqrt(qreal v)// Devuelve la raíz cuadrada del valor $v$.qreal qPow(qreal x, qreal y)// Devuelve el valor de $x$ elevado a la potencia $y$.
También necesitarás utilizar la función que pinta en la cuadrilla:
void switchOn(int x, int y, const QColor& color);// Pinta la celda $(x,y)$ con el color dado. (No tienes que preocuparte porQColorporque se pasa a la función por parámetro.)
Aunque no se ve en el archivo tools.cpp, hay una arreglo llamado mColors que contiene el color de todas las celas de la cuadrilla. Esto te ayudará a saber cuál color está en una celda: mColors[columns * y + x]. Nota que el índice de este arreglo se calcula utilizando la conversión para cambiar coordenadas $(x,y)$ a índices que explicamos arriba.
!INCLUDE “../../eip-diagnostic/gridplot/es/diag-gridplot-01.html”
!INCLUDE “../../eip-diagnostic/gridplot/es/diag-gridplot-02.html”
Sesión de laboratorio:
Ejercicio 1: Implementar las funciones para hacer funcionar los botones de dibujar líneas
Instrucciones
Descarga la carpeta
recursion-GridPlotterdeBitbucketusando un terminal, moviéndote al directorioDocuments/eip, y escribiendo el comandogit clone http://bitbucket.org/eip-uprrp/recursion-gridplotter.Carga a Qt creator el proyecto
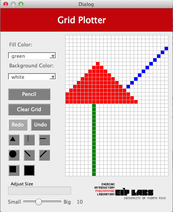
GridPlotterhaciendo doble “click” en el archivoGridPlotter.proque se encuentra en la carpetaDocuments/eip/recursion-gridplotterde tu computadora.El proyecto contiene el esqueleto para una aplicación para dibujar líneas o figuras en una cuadrilla. La aplicación tiene una interface que le permite al usuario seleccionar el color para pintar, el color para el trasfondo de la cuadrilla, la figura que se va a dibujar (por ejemplo, círculo, cuadrado) y el tamaño de la figura. La figura seleccionada se dibuja cuando el usuario marca una celda en la cuadrilla.
Estarás trabajando en el archivo tools.cpp. Tu primera tarea es implementar las funciones RowMajorFill, ColMajorFill, DiagonalLeft y DiagonalRight que hacen que los botones para dibujar líneas funcionen. La función RowMajorFill ya está implementada para que la tengas de ejemplo. Las funciones deben trabajar como se indica adelante.
RowMajorFill
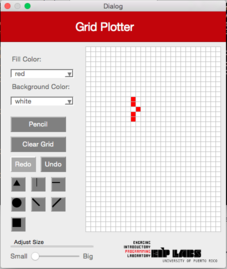
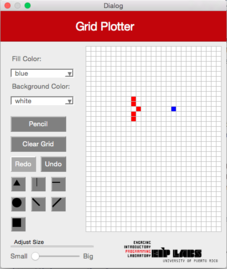
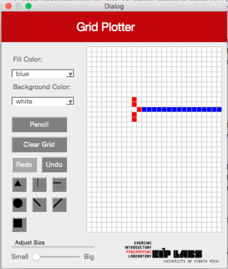
Cuando se selecciona la figura de línea horizontal en la interface, se dibujará una línea horizontal en la cuadrilla en la fila en donde el usuario marcó. La línea se expandirá a la derecha y a la izquierda de la celda marcada hasta que encuentre una celda (píxel) de un color diferente al color en el trasfondo, o hasta que la cuadrilla termine. La Figura 2 ilustra este comportamiento.
| (a) | (b) | © |
|---|----|----|
|  |
|  |
|  |
|
Figura 2 - (a) Un dibujo con trasfondo blanco y puntos rojos. (b) Cuando el usuario marca el botón de línea horizontal (RowMajorFill) y marca la celda mostrada, © se dibuja una línea horizontal que se expande hacia la izquierda y hacia la derecha de la celda marcada, hasta que se encuantra una celda con un color diferente al color de trasfondo.
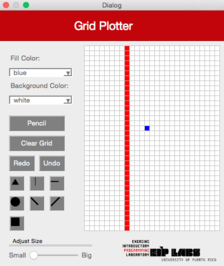
ColMajorFill
Esta función debe trabajar de manera similar a la función RowMajorFill pero para columnas. La Figura 3 ilustra su comportamiento.
| (a) | (b) | © |
|---|----|----|
|  |
|  |
|  |
|
Figura 3 - (a) Un dibujo con trasfondo blanco y puntos rojos. (b) Cuando el usuario marca el botón de línea vertical (ColMajorFill) y marca la celda mostrada, © se dibuja una línea vertical que se expande hacia arriba y hacia abajo de la celda marcada, hasta que se encuantra una celda con un color diferente al color de trasfondo.
DiagonalLeft
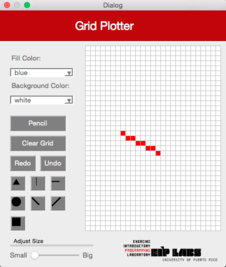
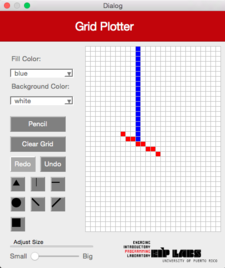
Esta función debe trabajar de manera similar a la función RowMajorFill pero produce una línea diagonal desde la izquierda superior hasta la derecha inferior. La Figura 4 ilustra su comportamiento.
| (a) | (b) | © |
|---|----|----|
|  |
|  |
|  |
|
Figura 4 - (a) Un dibujo con trasfondo blanco y puntos rojos. (b) Cuando el usuario marca el botón de línea diagonal izquierda (DiagonalLeft) y marca la celda mostrada, © se dibuja una línea diagonal izquierda que se expande hacia arriba a la izquierda y hacia abajo a la derecha de la celda marcada, hasta que se encuantra una celda con un color diferente al color de trasfondo.
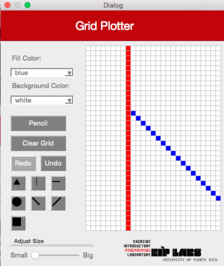
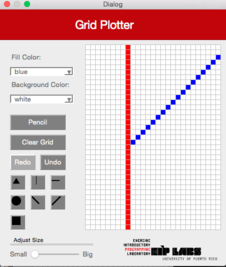
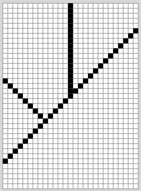
DiagonalRight
Esta función debe trabajar de manera similar a la función DiagonalLeft pero produce una línea diagonal desde la derecha superior hasta la izquierda inferior. La Figura 5 ilustra su comportamiento.
| (a) | (b) | © |
|---|----|----|
| | |  |
|
Figura 5 - (a) Un dibujo con trasfondo blanco y puntos rojos. (b) Cuando el usuario marca el botón de línea diagonal derecha (DiagonalRight) y marca la celda mostrada, © se dibuja una línea diagonal derecha que se expande hacia arriba a la derecha y hacia abajo a la izquierda de la celda marcada, hasta que se encuantra una celda con un color diferente al color de trasfondo.
Ejercicio 2: Implementar las funciones para hacer funcionar los botones de dibujar cuadrados, círculos y líneas.
Ahora implementarás la funcionalidad para dibujar cuadrados, círculos y líneas. El tamaño de la figura dibujada dependerá del tamaño seleccionado con la barra deslizante en la interface.
2a: Cuadrados
Para los cuadrados, ¡lo más fácil es pensar en ellos como si fueran cebollas! Un cuadrado de tamaño 1 es simplemente la celda marcada por el usuario. Un cuadrado de tamaño 2 es la celda marcada, cubierta por una capa de celdas de tamaño 1, y así sucesivamente. En otras palabras, un cuadrado de tamaño $n$ tendrá alto = ancho = $2n-1$.
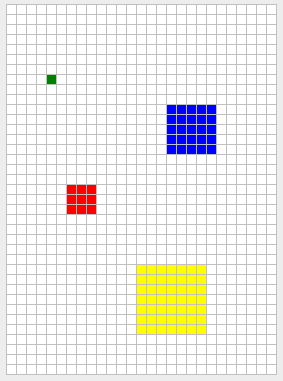
Figura 6 - Cuadrados de tamaño 1 (verde), 2 (rojo), 3 (azul), y 4 (amarillo). En cada caso, el usuario marcó la celda del centro del cuadrado.
2b: Triángulos
El botón de triángulo produce un triángulo isóceles como se muestra en la Figura 7. Para un tamaño $n$ seleccionado, el tamaño de la base será $2n + 1$. La altura debe ser $n+1$.
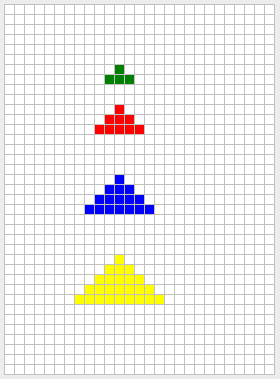
Figura 7 - Triángulos de tamaño 1 (verde), 2 (rojo), 3 (azul), y 4 (amarillo). En cada caso, el usuario marcó la celda del centro de la base del triángulo.
2c: Círculos
¡Felicitaciones! ¡Llegaste hasta la parte más difícil: círculos! Aquí tendrás que utilizar tus destrezas matemáticas … esperamos que te haya ido bien en tu clase de pre-cálculo …
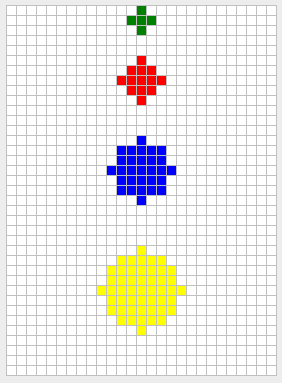
Figura 8 - Círculos de tamaño 1 (verde), 2 (rojo), 3 (azul), y 4 (amarillo). En cada caso, el usuario marcó la celda del centro del círculo.
Ayuda para producir los círculos:
Primero necesitas entender las expresiones asociadas a un círculo con ecuación: $x^2+y^2=r^2$. Por ejemplo, consideremos un círculo con radio $r=1$. La ecuación $x^2+y^2=1$ nos dice que todo punto $(x,y)$ que satisfaga la ecuación es un punto en la circunferencia del círculo. La expresión para un círculo relleno es: $x^2 + y^2 <=r^2$. Un círculo relleno, de radio $r=1$ tiene expresión $x^2 + y^2 <= 1$, lo que dice que cualquier punto $(x,y)$ que satisfaga $x^2 + y^2 <= 1$ es un punto en el círculo relleno.
¿Cómo producimos el círculo? Una manera sería generar todos los puntos cercanos al centro del círculo y determinar si éstos satisfacen la expresión $x^2 + y^2 <= r^2$. Por ejemplo, podemos tratar todos los puntos que están en el cuadrado de tamaño $2r+1$. Para un círculo de radio $r=2$ tendríamos que generar los siguientes puntos y probarlos en la expresión $x^2 + y^2 <=4$:
(-2, 2) (-1, 2) ( 0, 2) ( 1, 2) ( 2, 2)
(-2, 1) (-1, 1) ( 0, 1) ( 1, 1) ( 2, 1)
(-2, 0) (-1, 0) ( 0, 0) ( 1, 0) ( 2, 0)
(-2,-1) (-1,-1) ( 0,-1) ( 1,-1) ( 2,-1)
(-2,-2) (-1,-2) ( 0,-2) ( 1,-2) ( 2,-2)
En este caso, solo los puntos que se muestran abajo satisfacen la expresión $x^2 + y^2 <=4$.
                ( 0, 2)
        (-1, 1) ( 0, 1) ( 1, 1)
(-2, 0) (-1, 0) ( 0, 0) ( 1, 0) ( 2, 0)
        (-1,-1) ( 0,-1) ( 1,-1)
                ( 0,-2)
Ejercicio 3: Implementar la función para rellenar figuras utilizando recursión.
En este ejercicio implementarás la funcionalidad para rellenar de color las figuras. Una de las maneras más convenientes para expresar el algoritmo para rellenar es utilizando recursión. Un algoritmo recursivo básico (pero bastante flojo) se encuentra en Wikipedia:
Relleno (celda, color-buscado, color-reemplazo):
 1. Si color-buscado es igual al color-reemplazo, return.
 2. Si el color de celda no es igual al  color-buscado, return.
 3. Ajusta el color de celda al color-reemplazo.
 4. Ejecuta Relleno (un lugar a la izquerda de celda, color-buscado, color-reemplazo).
    Ejecuta Relleno (un lugar a la derecha de celda, color-buscado, color-reemplazo).
    Ejecuta Relleno (un lugar arriba de celda, color-buscado, color-reemplazo).
    Ejecuta Relleno (un lugar abajo de celda, color-buscado, color-reemplazo).
 5. Return.
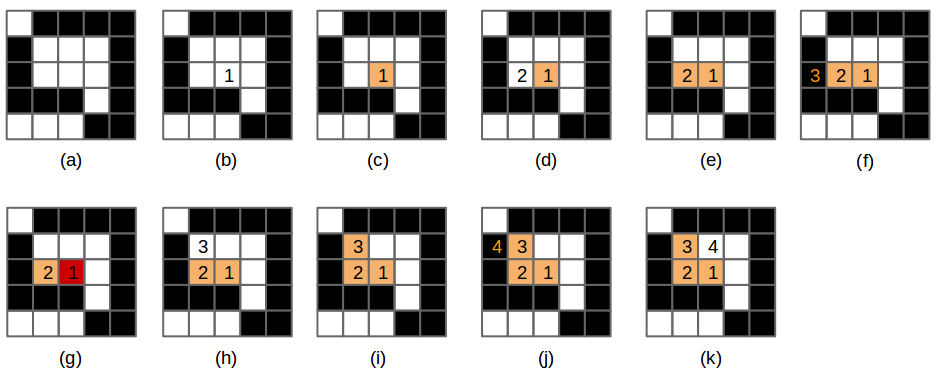
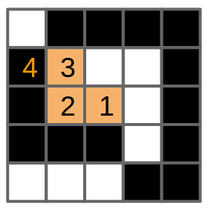
Figura 9 - (a) El dibujo original con trasfondo blanco y celdas negras. (b) Se selecciona una celda y se ejecuta el algoritmo de rellenar en esa celda (1), © La celda se pinta anaranjada, entonces (d) invoca relleno en la celda de la izquierda (2). (e) La celda 2 se pinta anaranjada, entonces (f) invoca relleno en la celda de la izquierda (3). Esta celda no es de color-buscado (es negra), la función regresa (returns).
(g) relleno se invoca en la celda de la derecha de la celda 2, pero esa celda ya está pintada del color-reemplazo. (h) relleno se invoca en la celda de arriba de la celda 2. (i) Esta celda se pinta anaranjada e (j) invoca relleno en la celda de la izquierda (4). Esta celda no es de color-buscado, por lo tanto la función regresa (k), celda (3) invoca relleno en su celda derecha.
Invoca la función relleno (flood-fill) y prueba su funcionamiento utilizando varias figuras. Asegúrate de probar figuras abiertas, como, por ejemplo, la siguiente:
Entregas
Utiliza “Entrega” en Moodle para entregar el archivo tools.cpp con las funciones que implementaste en esta experiencia de laboratorio. Recuerda utilizar buenas prácticas de programación, incluir el nombre de los programadores y documentar tu programa.
Referencias
[1] Alyce Brady and Pamela Cutter, http://nifty.stanford.edu/2005/GridPlotter/
[2] Sacha Schutz, http://www.labsquare.org
[3] http://en.wikipedia.org/wiki/Flood_fill
Repetition Structures - Grid Plotter
Objectives
Throughout this exercise the students will practice:
- For loops
- Nested for loops
Concepts
Possibly many users of Windows OS (if not the most) have used the Paint program, which is a simple graphics painting application. In that software, as in many others graphics painting programs, there are various tools (eg. pencil, paint bucket, line) which allows the user to draw on the graph in different ways.
In this laboratory we will make work some of these tools: square, circle, triangle, and some special lines… but don’t worry, it will be made in a simpler way.
The tools will be used by clicking any cell in the grid and (from that point) the cells required to form that shape will be painted. For example, if we use the vertical-line tool and then click on the cell (2,3) a vertical line should be painted over all the cells on the column 2 [(2, y) for all y into the grid].
Things you should know or recall:
- The coordinates in Qt goes a little bit different. From left to right is from zero to maximum width. From top to bottom is from 0 to maximum height.
- When we want to insert bidimensional data (such as the grid that has x and y) into a simple array we use a formula. For every point (x,y) in the grid, we solve number-of-columns * y + x and the result will be the index of the point in the array. Example: The index of the point (1,2) in a 5 width grid is 5*2+1 = 11
Libraries
For this project you only need to use some of the functions of QtGlobal for the implementation of the circle:
- int qFloor(qreal v) // Returns the floor of the value v.
- qreal qSqrt(qreal v) // Returns the square root of v.
- qreal qPow(qreal x, qreal y) // Returns the value of x raised to the power of y.
And use the funcion that paints on the grid:
- void switchOn(int x, int y, const QColor& color); //It paints the cell (x,y) with the color given. (You don’t have to worry about QColor because is given to you by parameter.)
Though it is not visible in this file (tools.cpp), there exists an array called mColors that contains the colors of all the cells of the grid. This will help you to know what color is in a cell: mColors[columns * y + x]
!INCLUDE “../../eip-diagnostic/gridplot/en/diag-gridplot-01.html”
!INCLUDE “../../eip-diagnostic/gridplot/en/diag-gridplot-02.html”
Laboratory session:
Exercise 1
The Qt project at HERE??? contains the skeleton for an application to draw lines or shapes on a grid. The application allows the user to select the color to paint, the color of the grid background, the painting shape (e.g., circle, square) and size of the tool. The selected shape is drawn when the user clicks the grid.
Your first job is to implement the functions to make the row-major-fill, col-major-fill, left-diagonal and right-diagonal buttons work. The function row-major-fill has been implemented for you as an example. The functions should work as follows.
row-major:
When this shape is chosen, a horizontal line will shall be drawn in the grid in the row where the user clicks. The line should expand to the left and right of the cell clicked by the user until it finds a pixel whose color is not the background color (or the grid ends). Figure 1 illustrates this behavior.
| (a) | (b) | © |
|---|----|----|
| | | |
Figure 1 - (a) A painting with a white background and red dots. (b) When the user clicks the row-major button and clicks the shown cell © a horizontal line is drawn that expands to the left and right of the clicked cell until a cell of non-background color is found.
columns-major
This button should work similar to the row-major but for columns. Figure 2 illustrates this behavior.
| (a) | (b) | © |
|---|----|----|
| | | |
Figure 2 - (a) A painting with a white background and red dots. (b) When the user clicks the columns-major button and clicks the shown cell, © a vertical line is drawn that expands to the top and botton of the clicked cell until a cell of non-background color is found.
left-diagonal
This button should work similar to the row-major but produces a diagonal from upper left to lower right. Figure 3 illustrates this behavior.
| (a) | (b) | © |
|---|----|----|
| | | |
Figure 3 - (a) A painting with a white background and red dots. (b) When the user clicks the left-diagonal button and clicks the shown cell © a left-diagonal line is drawn that expands from the top left to the bottom right of the clicked cell until a cell of non-background color is found.
right-diagonal
This button should work similar to the left-diagonal but produces a diagonal from bottom left to top right. Figure 4 illustrates this behavior.
| (a) | (b) | © |
|---|----|----|
| | | |
Figure 4 - (a) A painting with a white background and red dots. (b) When the user clicks the right-diagonal button and clicks the shown cell © a right-diagonal line is drawn that expands from the bottom left to the top right of the clicked cell until a cell of non-background color is found.
Exercise 2 a
Let’s implement the functionality to draw the square, triangle and circle. The size of the drawn shape will depend in the size chosen using the slide bar.
For the squares (the easiest) you may think of them as if they were onions! A square of size 1 is just the cell clicked by the user. A square of size 2 is the clicked cell with a layer of 1 cell, and so forth. In other words, a square of size $n$ will have height = width = $2n-1$
Figure 5 - Squares of size 1 (green), 2 (red), 3 (blue), and 4 (yellow). In each case, the user clicked on the cell at the center of the square.
Exercise 2 b
The triangle button should produce an isosceles triangles as shown in Figure 6. For a chosen size n the base will be $2n + 1$. The height should be $n + 1$.
Figure 5 - Triangles of size 1 (green), 2 (red), 3 (blue), and 4 (yellow). In each case, the user clicked on the cell at the center of the base of the triangle.
Exercise 2 c
Congrats, you made it to the hardest part: circles! Here you need to use your math skills… hope you did well in that class.
Figure 5 - Circles of size 1 (green), 2 (red), 3 (blue), and 4 (yellow). In each case, the user clicked on the cell at the center the circle.
Here is a hint on how to produce the circles. You need to start by understanding what their equation ($r^2 = y^2 + x^2$) means. As an example, lets consider $r=1$. The equation for a circle with $r = 1$ means that any point $(x,y)$ such that $x^2 + y^2 = 1$ is a point in the circumference of the circle. The equation for a filled circle is $x^2 + y^2 <=r^2$. A filled circle of radius 1 has an equation $x^2 + y^2 <= 1$, which means that any point $(x,y)$ such that $x^2 + y^2 <= 1$ is a point in filled circle.
How to produce a circle? One way would be to generate all points in the proximity of the center of the circle and determine if they comply with $x^2 + y^2 <= r^2$. For example, we could try every point that is in the square of size $2r+1$. For a circle of $r=2$ we would need to generate all the following points and test them against the $x^2 + y^2 <=4$ equation:
(-2, 2) (-1, 2) ( 0, 2) ( 1, 2) ( 2, 2)
(-2, 1) (-1, 1) ( 0, 1) ( 1, 1) ( 2, 1)
(-2, 0) (-1, 0) ( 0, 0) ( 1, 0) ( 2, 0)
(-2,-1) (-1,-1) ( 0,-1) ( 1,-1) ( 2,-1)
(-2,-2) (-1,-2) ( 0,-2) ( 1,-2) ( 2,-2)
In this case, only the shown points would comply to the equation.
                ( 0, 2)
        (-1, 1) ( 0, 1) ( 1, 1)
(-2, 0) (-1, 0) ( 0, 0) ( 1, 0) ( 2, 0)
        (-1,-1) ( 0,-1) ( 1,-1)
                ( 0,-2)
Exercise 3
You will now implement the flood fill functionality. One of the most convenient ways to express the algorithm for flood fill is using recursion. A basic (but rather wastefull) recursive algorithm is given in Wikipedia:
Flood-fill (node, target-color, replacement-color):
 1. If target-color is equal to replacement-color, return.
 2. If the color of node is not equal to target-color, return.
 3. Set the color of node to replacement-color.
 4. Perform Flood-fill (one step to the west of node, target-color, replacement-color).
    Perform Flood-fill (one step to the east of node, target-color, replacement-color).
    Perform Flood-fill (one step to the north of node, target-color, replacement-color).
    Perform Flood-fill (one step to the south of node, target-color, replacement-color).
 5. Return.
Figure 6 - (a) The original drawing with white background and black pixels. (b) A pixel is chosen and the flood fill algorithm is run on that cell (1), © the cell is painted orange, then (d) invokes flood-fill on its west cell (2). (e) cell 2 is painted orange, then (f) invokes flood-fill on its west cell (3). This cell is not of the target color (it is black), the function returns. (g) flood fill is invoked on the cell to the east of cell 2, however that cell is already changed to the target color. (h) flood fill is invoked on the cell to the north of cell 2. (i) This cell is painted orange and (j) invokes flood cell on its west cell (4). This cell is not of target color, thus the function returns (k) cell (3) invokes flood fill on its east cell.
Implement the flood fill function and test filling out various shapes. Be sure to test open shapes, such as the following:
Deliverables
In the following textboxes, copy the functions that you developed for the program. Remember to properly comment all functions and use good indentation and variable naming practices.
References
[1] Alyce Brady and Pamela Cutter, http://nifty.stanford.edu/2005/GridPlotter/
[2] Sacha Schutz, http://www.labsquare.org